Market size and market share for adtech industry/online advertisement ecosystem
The online advertising market is dominated by a few major players, with significant regional variations. The global online advertising industry continues to grow, at about $600 ~ $700 billion today, and showing no signs of slowing down [6].

Global market size of digital advertising. Source.
The market is highly concentrated. Based on data in 2019, Google and Facebook (Meta) account for approximately half of the digital advertising global revenue [2].
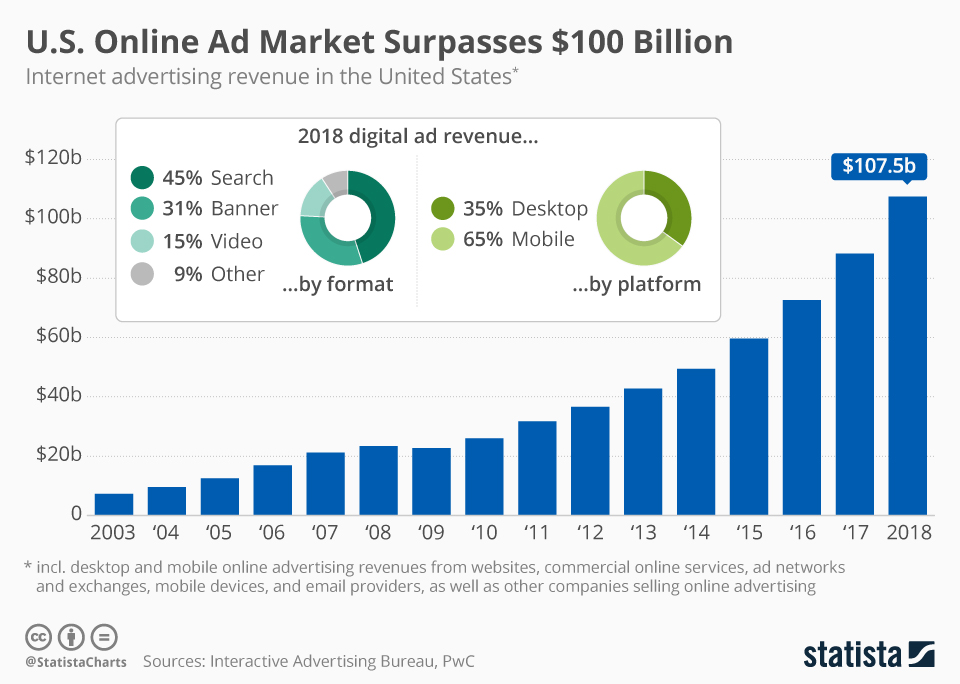
The US market already hit the 100 billion USD milestone back in 2018. Big Tech companies (Amazon, Apple, Google, Meta, and Microsoft) are expected to control 65.6% of digital advertising revenues by 2024, up from 30.8% in 2008 [1].
India’s digital advertising market size is $4.86 billion 2023, and be estimated to hit $7.5 billon by 2025. As of market component, it is heavily dominated by Meta and Alphabet (Google), which together held 68% of the market share in 2022 [5].
As for China: in 2024, China’s online advertising market is expected to grow to 153 billion yuan (approx. $21.10 billion), dominated by short video and social media ads (aka walled gardens). Major platforms like WeChat, Douyin, and Weibo hold significant market shares, indicating a centralized rather than diversified market.
The global landscape
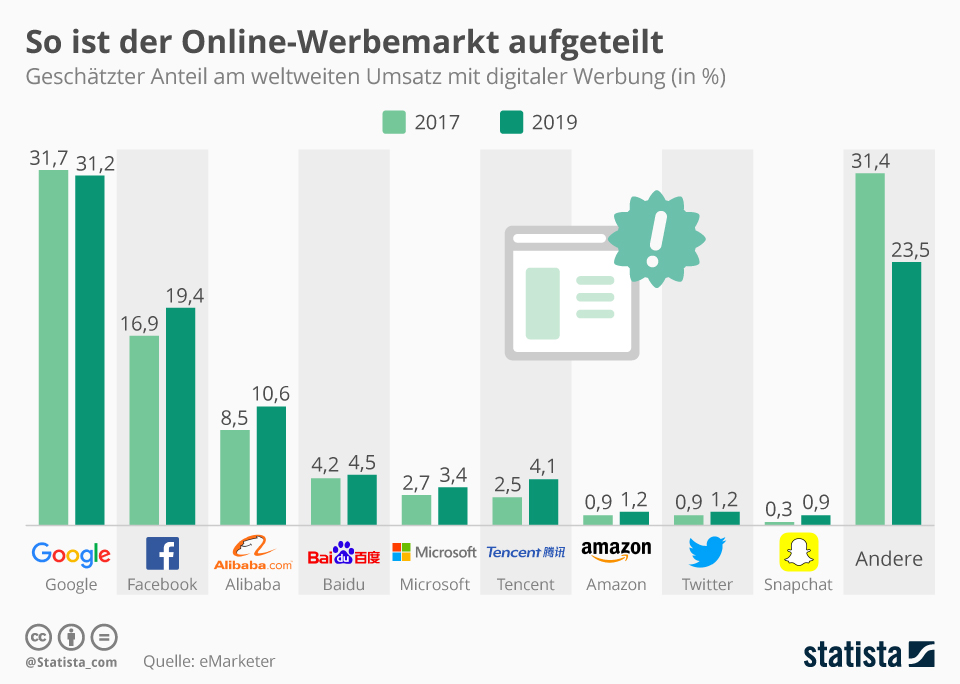
Back in 2019, (some) people are still talking about the digital ad industry to be more divided:
 source: So ist der Online-Werbemarket aufgeteilt | Statistia. Archived picture is available here (in case html link fails).
And when is goes to 2023:

Global landscape of digital advertising 2023. Source.
According to eMarketer, Google and Facebook are responsible for around half of digital advertising revenue. The two tech giants owe this to the market-dominating position of their online platforms (including Google, YouTube, Facebook and Instagram). Alibaba follows in third place. Analysts assume that the Chinese will increase their share of online advertising revenue to over ten percent by 2019. Snapchat is also trending towards growth. The company’s advertising revenue could triple, albeit only from 0.3 to 0.9 percent.
U.S.
 source: Statista. Archived picture is available here (in case html link fails).
Interestingly, the online advertising market is still highly concentrated, with the top 10 ad-selling companies accounting for 75 percent of revenues. As search and social media advertising accounts for 45 and 27 percent of total revenue, respectively, it’s not hard to guess which two companies are the dominant players in the digital advertising landscape. (source)
 source. Archived picture is available here (in case html link fails).
India
Market size of the digital advertising industry across India from 2016 to 2023, with estimates until 2025:

Market size of india. source.

Distribution of digital advertising market in India in financial year 2021 and 2022, by platform ecosystem. source.
China
China has a different internet landscape—to use most internet services one has to register phone number. This makes cookie-less tracking and first party information widely available for advertisers. Apps and tech companies however, tend to build up their own exclusive ecosystem thus protecting market power by having their private user base.
According to Statista’s report on social media advertising and marketing in China (source):

Market share of online advertising in China in 2022 and 2023, with estimates until 2025, by ad category.
Most of the time, retail media ads goes through social media apps—because China’s social media app (yes, e.g. the notoriously famous WeChat) are all comprehensive bundles that can do everything—ride hailing, financing, news feeds, food delivery, ordering, browsing websites, games, etc.. So, the landscape of social media ads would be reflective of the market as a whole:
Social media advertising revenue in China from 2012 to 2020 with a forecast until 2023 (in billion yuan)
Just to get a glimpse of the popularity landscape of China social media:

Social media advertising revenue in China from 2012 to 2020 with a forecast until 2023 (in billion yuan)
In China, recommendation-based marketing, or “zhongcao”, was among the most effective forms of marketing. The Chinese social commerce platform Xiaohongshu was the most popular channel to post zhongcao content. In 2022, it contributed over half of such posts among five major social media platforms measured. Short video giant Douyin came in second. Read more
Lastly, market shares (in some way):

How much do advertisers spend in different social media platforms, in September 2023, by internet platform.
reference
[1] Statistic: Market share of Big Tech (Amazon, Apple, Google, Meta, Microsoft) in digital advertising revenue in the United States in 2008 and 2024
[2] Infographic: So ist der Online-Werbemarkt aufgeteilt
[5] Statistic: Distribution of digital advertising market in India in financial year 2021 and 2022, by platform ecosystem
[6] Infographic: U.S. Online Ad Market Surpasses $100 Billion